Displaying Leader Lines in GeoServer (and QGIS)
I’ve recently been experimenting with label placement, mostly in the context of QGIS. This all started when one of the trainees on a QGIS course I was running asked if it was possible to convert the labels to graphics so they could hand place them (as they would in ArcGIS). First I had to get him to explain exactly what this meant as I haven’t used Arc for years and would never hand place my labels even if I did (after all GeoTools and GeoServer have a wonderful labelling engine that takes care of that for me).
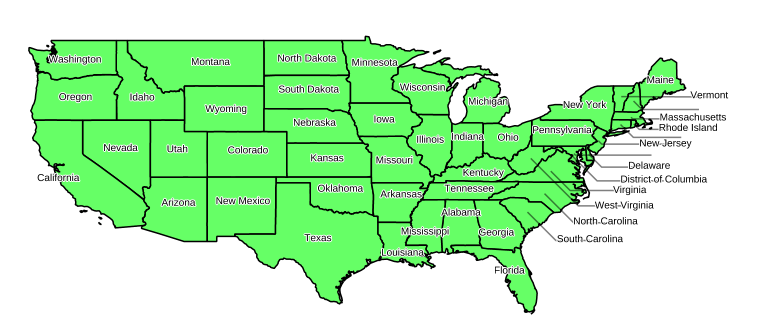
After some digging I found Regis Haubourg’s wonderful Easy Custom Labelling plugin for QGIS. This allows you to create a new geographic layer with a copy of the label field and all the necessary attributes to position, rotate your labels and with the ability to show a leader line from the label back to the feature the label goes with. When combined with the Memory Layer Saver plugin to make these changes persistent it becomes easy to make a map with the labels just the way you like them.
The next question came on the GeoServer user list when Piotr Kosz asked if there was a way to insert leader lines in a GeoServer map using SLD. I started thinking about this and wondered if you could do something using the QGIS layer and some clever SLD.
After a bit of experimenting it turns out you can. First you need to save the label layer as a shapefile (or other GeoServer supported format), then add it as a new layer. Then you need to place the labels at the end of the lines (for the labels that have not been moved the line has no length and is a point at the centroid of the polygons). This is easy to do with a geometry function:
<Geometry>
  <ogc:Function name="endPoint">
    <ogc:PropertyName>the_geom</ogc:PropertyName>
  </ogc:Function>
</Geometry>
You can also filter out any labels that have been hidden by adding a filter to the rule containing the TextSymbolizer:
<ogc:Filter>
  <ogc:PropertyIsEqualTo>
    <ogc:PropertyName>LblShow</ogc:PropertyName>
  <ogc:Literal>1</ogc:Literal>
  </ogc:PropertyIsEqualTo>
</ogc:Filter>
and finally only turn on the leader lines for the labels that have LblShowCO
set to true (we could also have checked for the end point being disjoint from
the polygons):
<ogc:Filter>
  <ogc:PropertyIsEqualTo>
    <ogc:PropertyName>LblShowCO</ogc:PropertyName>
    <ogc:Literal>1</ogc:Literal>
  </ogc:PropertyIsEqualTo>
</ogc:Filter>
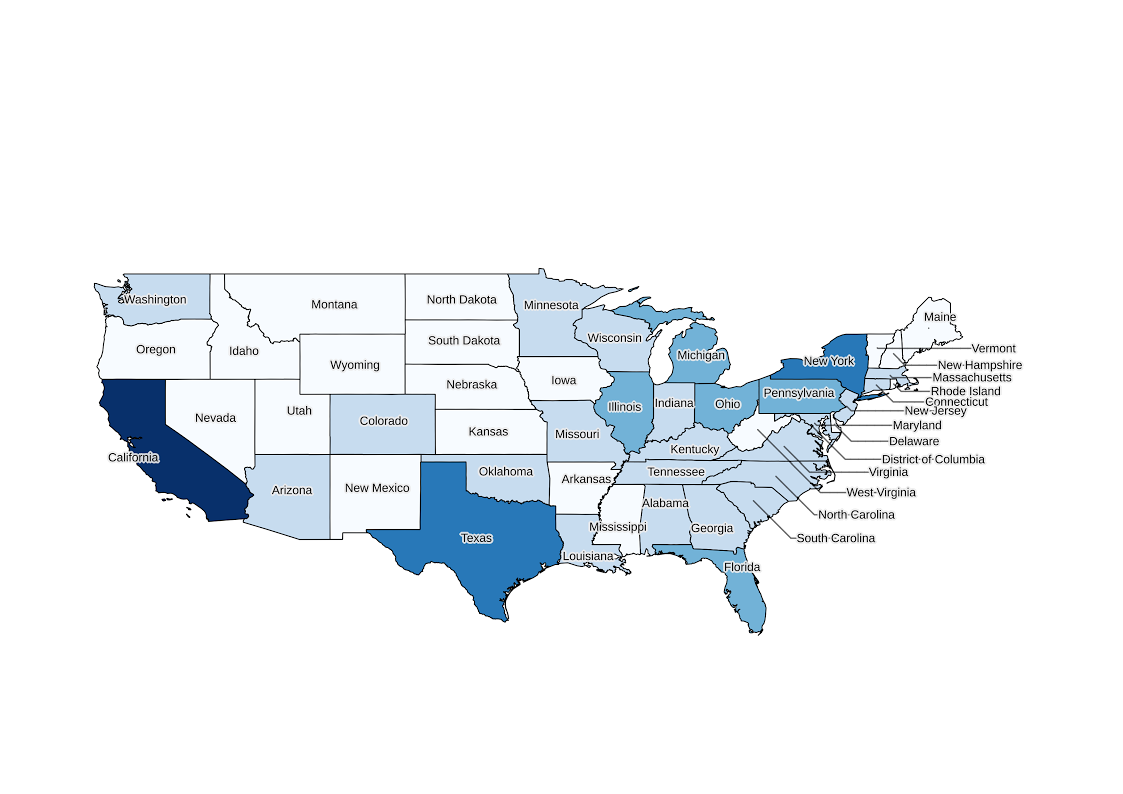
This produces a very similar looking map in GeoServer:
Further work might look at adding scale dependencies as once the user has zoomed in to the eastern seaboard there is probably enough room for the labels to fit in their state boundary (and a risk of the label going off the side of the map).
You can download the full SLD file from here.