Fun with Graticules
I have spent some time recently working on adding graticules to maps created with GeoTools. A graticule is the network of lines you see on some maps that represent the meridians and parallels (or similar orthogonal lines in another projection).
While this looks easy there are some subtle issues (and I wanted it to be automated) - first if you look at that picture you think it is just a few straight lines crossing to make a grid, just some graph paper really. But if we ever reproject the map (and often we do just that) if the lines aren’t densified (adding extra points to them) they don’t bend right.
Now fortunately GeoTools provides a Grid class that allows you to make exactly this sort of grid and even provides a way to densify them so you can reproject them too. These are fantastic and would appear to solve all my problems, but I still have to work out where to draw the lines and then I would also like to label them.
At first I thought I could work directly with the Grid.class but it turns out that these grids are polygons whereas I need lines that go all the way across or up and down the map (or the labels look really wrong). Fortunately there is a Lines class that produces OrthoLines (You have to read all the way to the end of the Grids page to find it).
So my only remaining problems were how to label the lines and how to decide on the space between lines automatically. To add labels I had to extend OrthoLineBuilder to provide actual labels. I made use of the CoordinateFormatter class to make the X or Y values look nice (and checked the CRS for a Unit if it had one).
The labels are added to the features in the setAttributes method which was all I had to override.
  formatter.setCoordinateReferenceSystem(type
    .getCoordinateReferenceSystem());
  xFormat = formatter.getFormat(0);
  yFormat = formatter.getFormat(1);
  CoordinateSystem coordinateSystem = type.getCoordinateReferenceSystem()
    .getCoordinateSystem();
  xUnit = "" + coordinateSystem.getAxis(0).getUnit().toString();
  yUnit = "" + coordinateSystem.getAxis(1).getUnit().toString();

[....]

    if (orthoLine.getOrientation() == LineOrientation.HORIZONTAL) {
      value = v0.y;
      label = yFormat.format(v0.y)+yUnit;
    } else {
      value = v0.x;
      label = xFormat.format(v0.x)+xUnit;
    }
So now all I needed was an automatic way of creating nice grids. A search for nice graticules found nothing of any use, then I had a brain wave at 3am - graph axes must have the same problem! It turns out that I was right lots (well some) people have thought about the same issues. The first I tried was based on this stackexchange answer by Incongruous. This is based on the observation that:
The primary observation is that the “nicest” numbers in decimal are 1, 2, and 5, and all power-of-ten multiples of these numbers. We will use only such numbers for the tick spacing, and place tick marks at multiples of the tick spacing…
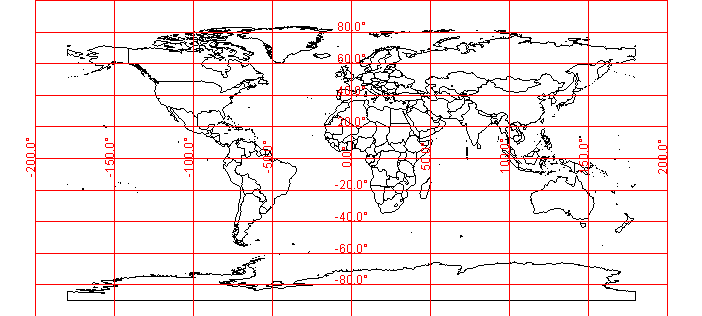
The code provided worked with remarkably few fixes and gives a map of the world like:
which looks OK(ish) but the fact that the algorithm has “rounded up” to 100 and 200 degrees looks odd to me as a geographer. So I kept searching and soon came up with a link to Justin Talbot’s paper on An Extension of Wilkinson’s Algorithm for Positioning Tick Labels on Axes. This describes a method for solving exactly the problem I’m wrestling with. Even better when you go to Justin’s web page there is a link to some Java code that implements the algorithm. The only thing missing is a license that gives me the right to use the code!
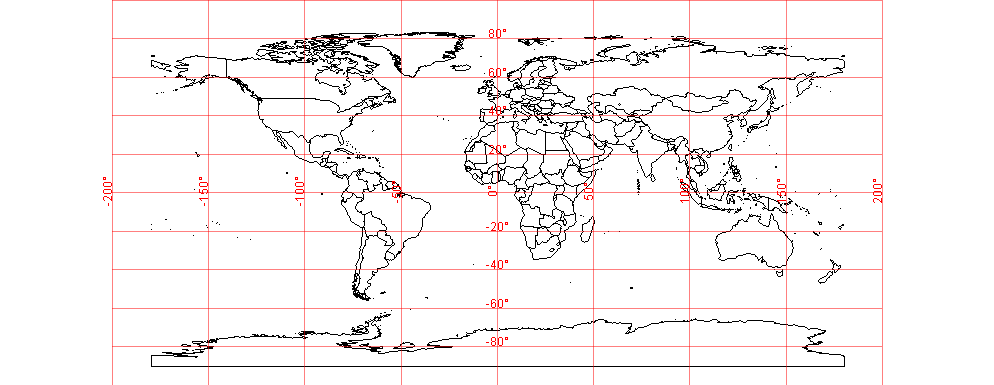
So using the new algorithm gives a map like:
which looks much nicer.
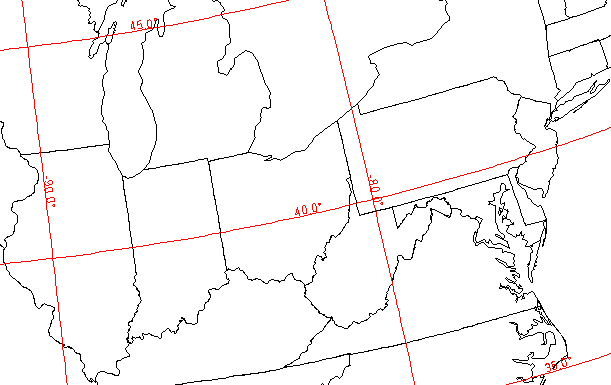
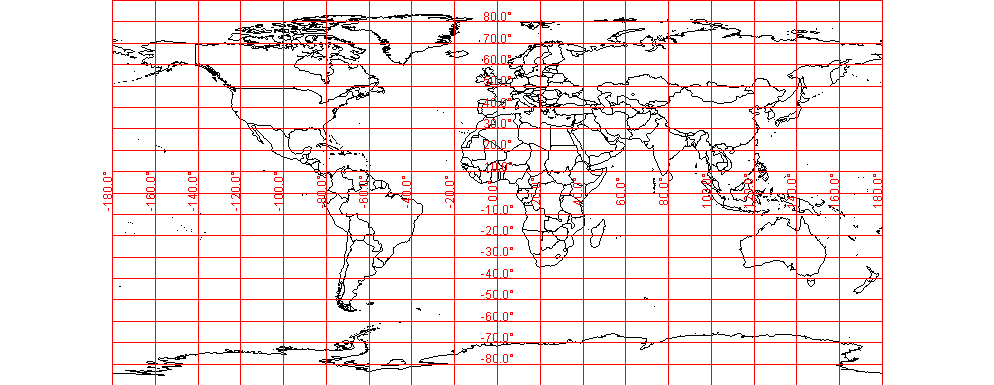
The whole world is a fairly easy test as the grids start and end on nice round numbers, what about for a more arbitrary map:
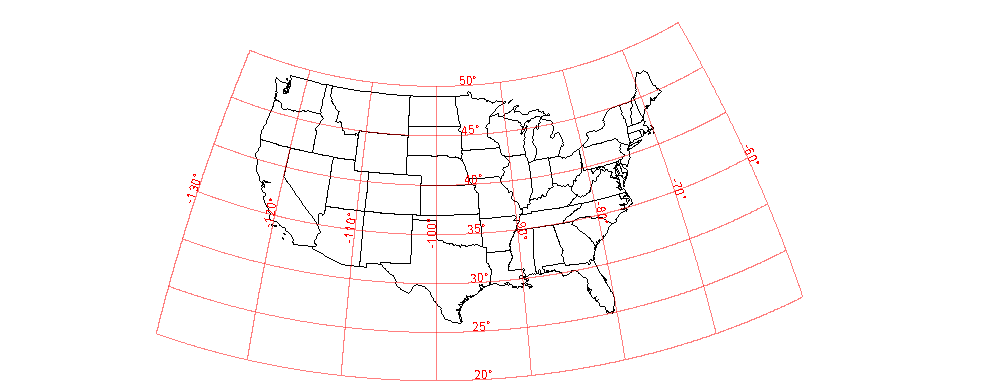
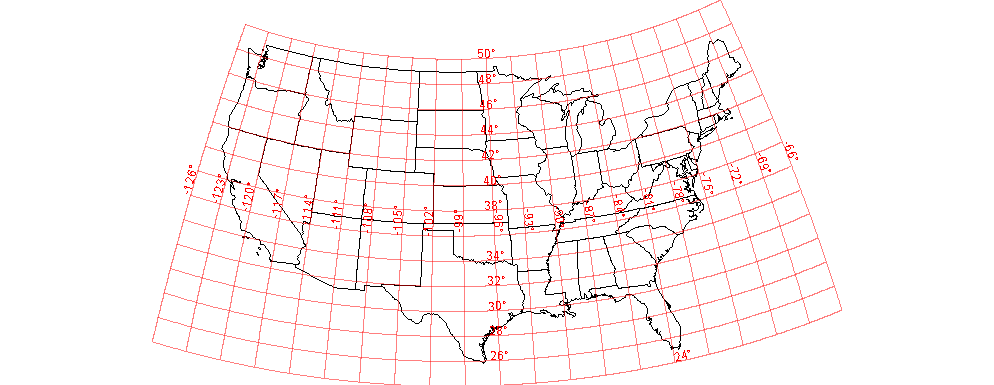
Again I prefer the extended Wilkinson (the second map) but both would be acceptable.
In the future I plan to add the extensions in the GeoTools library to allow others to make use of this work, the main sticking point is the license of the extended Wilkinson code. Once the code is in GeoTools it should be possible to make a WMS decorator in GeoServer to allow automated graticules on WMS images.