Classifying and Styling Shapefiles
One of the common complaints I hear is that styling map layers with SLD (Styled Layer Description language) files is too hard and requires too much typing. I always feel that this misses the point of SLD – you are not supposed to type it in your self. (And before anyone mentions CSS I don’t think you should type that by hand either).
SLD files are XML files that describe how a feature collection should be rendered. It is an Open Geospatial Consortium (OGC) standard which means that you can use it across programs to make your maps look similar regardless of who is drawing it. Sadly it is less widely used than I’d like, but if you use GeoServer to display your maps then the chances are you will need some SLD skills.
I started a simple Shapefile Viewer a few weeks ago as I needed to sort out a bunch of random shapefiles in one of my data directories and starting QGis up each time I couldn’t remember what file1.shp was. Over time, as I scratched more itches, I added features to it including the ability to apply a classifier to the data and automatically generate an SLD file.
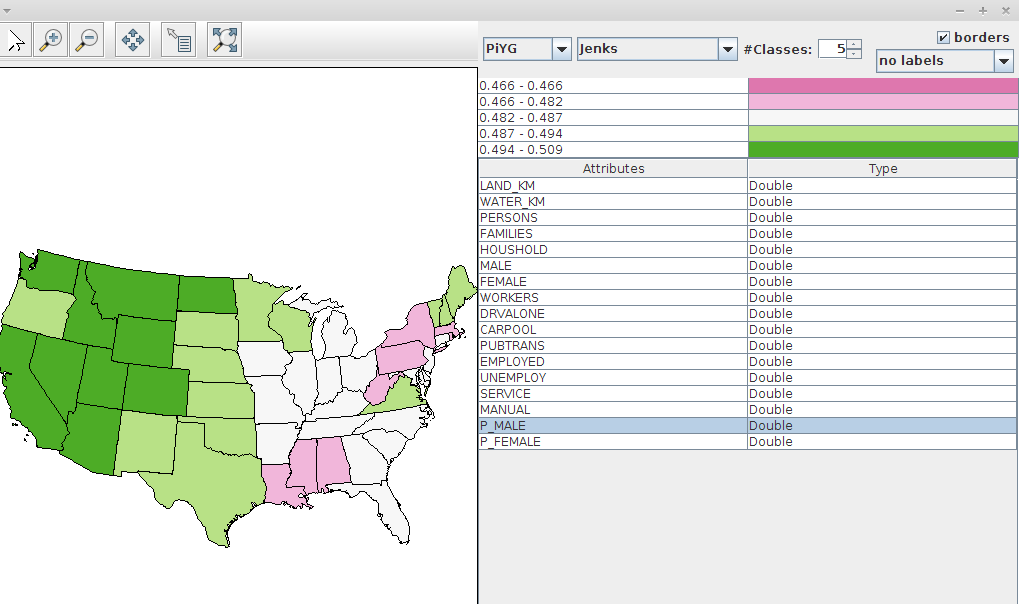
When you add a shapefile (or specify it on the command line) it displays it and a listing of the attributes with a numeric type. When you click on one of the attributes, the classifier chosen at the top (Jenks in the example above) is applied to that column of data and then the map is coloured using the chosen palette from ColorBrewer.
There are menu options to save the style to disk as a SLD file and to save the map as a SVG file.
All the code for the program is available as a new project on github - https://github.com/ianturton/ShapefileViewer . Once you’ve cloned a simple mvn assembly:single should produce an executable jar for you to run.
Feel free to fork and add your own features, the issues list shows some of the directions I’m thinking of going in.