GeoTools Contouring
GeoTools Contouring
Anyone who follows me on twitter may have seen a recent tweet about implementing contouring. This post gives more details that will fit in the 280 character limit.
The Problem
People occasionally ask if they can create contours or
isochrones
or other
iso-lines
in GeoTools. Until now the answer has always been the there is a contouring process in
the gt-process-raster module that will take a GridCoverage2d and produce a set of
contours from it. But if you had a set of discrete points that you want to contour then
you needed to convert them into a grid using a Barnes Surface Interpolator (and more on
this later).
What is a contour?
This image from the Ordnance Survey explains how contour lines show a pair of small hills.

Their guide to understanding contours does a very good job of explaining how to understand contours.
Existing Solution
If you have a gridded data set (such as the Ordnance Survey’s Terrain® 50 dataset) you can process it using the org.geotools.process.raster.ContourProcess (and this will even work in an SLD rendering transformation). If you want to follow along you will need to grab the ASCII grid tiles and process them into a GeoTiff with internal tiling and compression. You will also need the GeoPackage of the contours and spot heights for later while you are there.
  org.geotools.process.raster.ContourProcess rcp = new ContourProcess();
  AbstractGridFormat format = GridFormatFinder.findFormat(source);
  org.geotools.util.factory.Hints hints = null;
  if (format instanceof GeoTiffFormat) {
    hints = new Hints(Hints.FORCE_LONGITUDE_FIRST_AXIS_ORDER, Boolean.TRUE);
  }

  AbstractGridCoverage2DReader reader = format.getReader(source,
      hints);
  GridCoverage2D grid = reader.read(null);
  reader.dispose();
  Date start = new Date();
  SimpleFeatureCollection results = rcp.execute(grid, 0, levels, 0.0, true, true, null, null);
  Date end = new Date();
  System.out
      .println(results.size() + " raster contours " + (end.getTime() - start.getTime()) / 1000.0 + " seconds");
  File ras_contours = new File("raster-contours.shp");
  DataStore rods = fac.createNewDataStore(Collections.singletonMap(fac.URLP.key, URLs.fileToUrl(ras_contours)));
  SimpleFeatureType schema = results.getSchema();

  rods.createSchema(schema);
  SimpleFeatureStore rstore = (SimpleFeatureStore) rods.getFeatureSource(rods.getTypeNames()[0]);
  rstore.addFeatures(results);
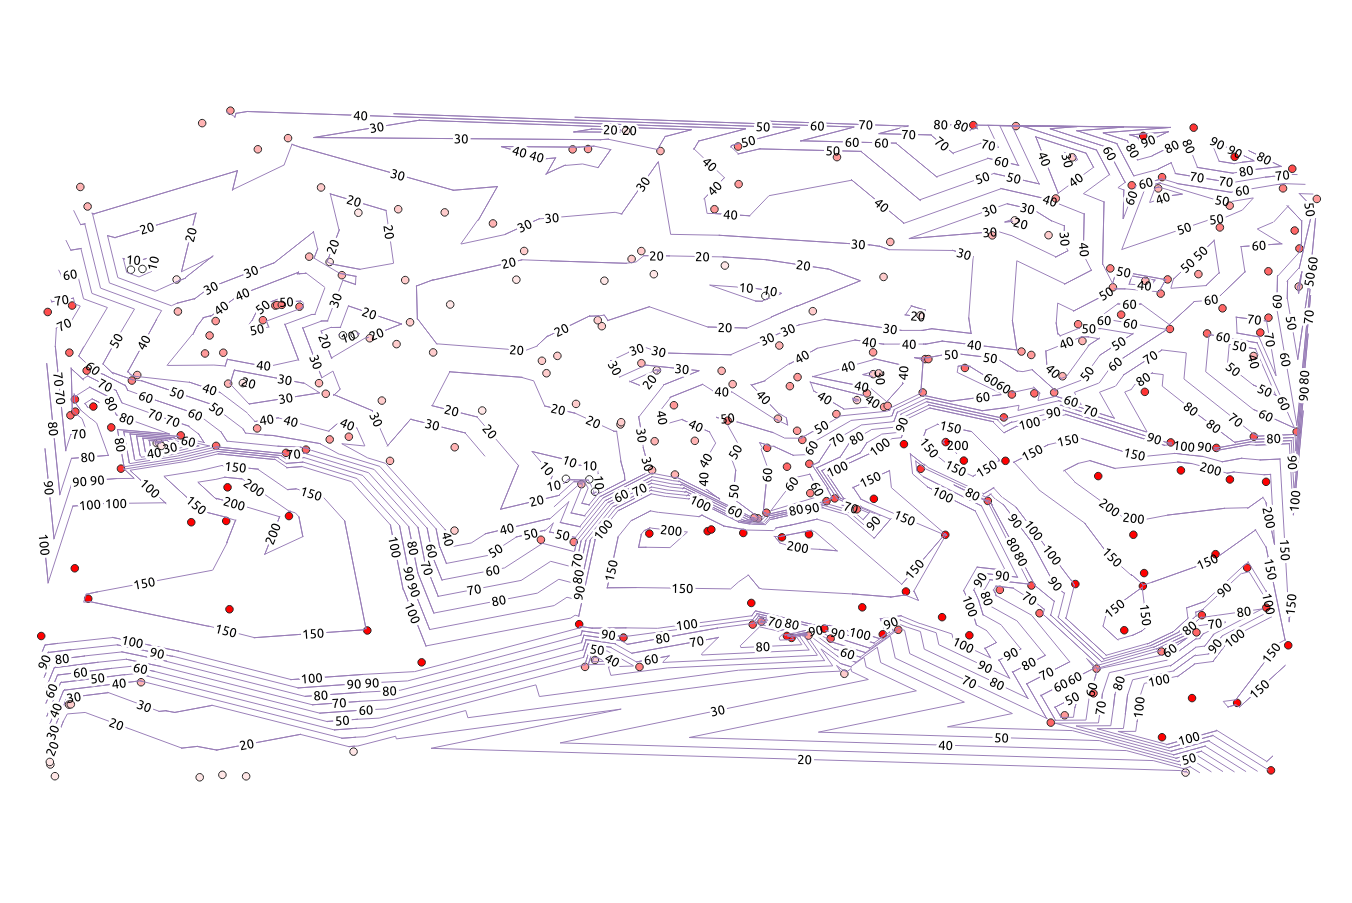
Processing the GB data set takes me 182 seconds and produces 59.6 thousand contours.
| Ordnance Survey Contours | Raster Processing Contours |
|---|---|
 |
 |
(You can expand those images by clicking on them).
As you can see there is some difference between the Ordnance Survey’s contours and the ones that GeoTools generates which is to be expected as the Ordnance Survey have a lot more data to process into their contour process (and I expect they took a lot more than 182 seconds producing theirs). There are some interesting anomalies that show up which we’ll come back to later. But this is all a bit like hard work (especially sitching the ASCII grids together to make a useful raster) and the original question was how to generate contours from a set of irregular points.
How to contour a set of points?
Googling led me to the marching squares algorithm, but it seems to be for “rectangular arrays of values” (though that page hints that it may be possible for triangular meshes too). I also came across Zachary Johnson’s blog entry from 2008 discussing a flash method. To be honest that was much easier to follw than the wikipedia page.
Since I knew that Dr JTS (Martin Davis) had already done the hard bit of writing a Delauny Triangulation method in JTS all I needed to do was interpolate along the sides of the triangles. As you can imagine it was a little harder than that but not much. Infact once I realised what the triangles on the wikipedia page were all about and that I could use LineString.pointAlong() method to calculate the crossing points once I had the proportion of the contour between the endpoints, it went quite well.
Most of the code is working out if a given contour intersects the triangle and which two edges it hits, which turns out to be mostly bookkeeping and edge case handling.
My first attempts looked pretty good, but could be improved as they look a little spiky.
I thought smoothing would be a hard problem, but it turns out Martin has been there before me again, the GeoTools JTS utilities class provides a smooth() method which was easy. I did do some experiments to find out what the parameters mean, that clarified some things, and made things look even nicer.
At this point I decided to move my scrappy development code into the main GeoTools code base, so I raised an enhancement ticket where Andrea promptly said why didn’t I just use the Barnes interpolation with the raster contour process. So, I went off an spent several days trying to do this and eventually threw in the towel. I can’t work out any set of parameters to feed the Barnes process that doesn’t even take more than several hours to complete or returns a flat surface. I may go back to experimenting with it later or may be not.
So, I finished up converting my code into the sort of process that GeoTools handles and merged it today so if you want to play then you will need a nightly built after the 24th December, 2020.
Results
      Date start = new Date();
      org.geotools.process.vector.ContourProcess vcp = new org.geotools.process.vector.ContourProcess();
      SimpleFeatureCollection results = vcp.execute(input, "propertyVa", levels, 0.0, true, true, null);
      Date end = new Date();
      System.out
          .println(results.size() + " vector contours " + (end.getTime() - start.getTime()) / 1000.0 + " seconds");
      File vec_contours = new File("vector-contours.shp");
      DataStore ods = fac.createNewDataStore(Collections.singletonMap(fac.URLP.key, URLs.fileToUrl(vec_contours)));
      SimpleFeatureType schema = results.getSchema();

      ods.createSchema(schema);
      SimpleFeatureStore store = (SimpleFeatureStore) ods.getFeatureSource(ods.getTypeNames()[0]);
      store.addFeatures(results);
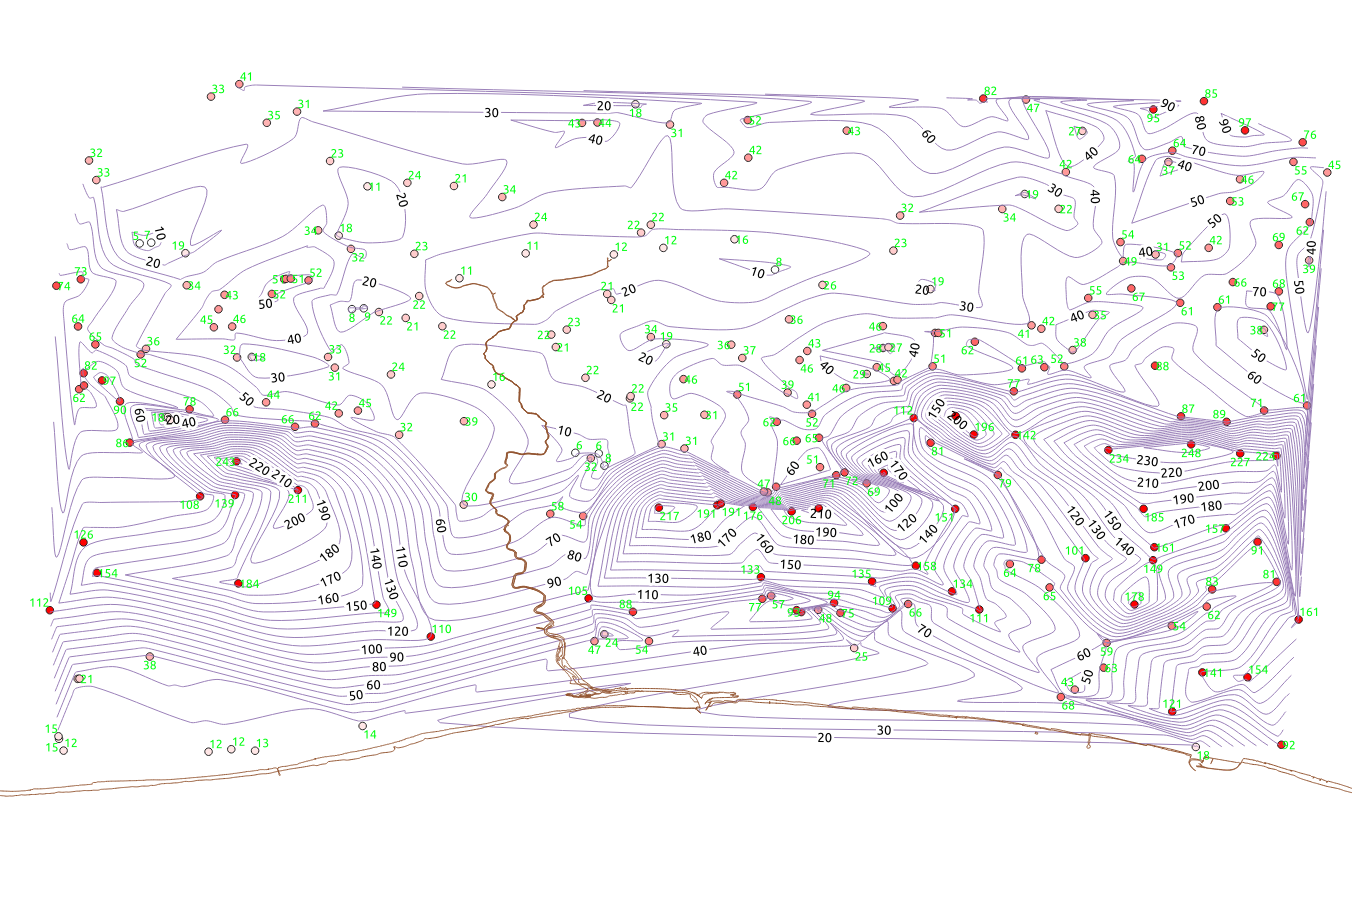
Processing the GB data set takes me 29 seconds and produces 19312 contours.
| Ordnance Survey Contours | Vector Processing Contours |
|---|---|
|
 |
(You can expand those images by clicking on them).
The difference in number of contours produced (and probably the speed too) is down to the fact that instead of processing a 50m grid (327 million pixels) we are using (just) 2.25 thousand spot heights (that is more than are in the terrain dataset because I added in points along the land/water boundary to help with 0s).
Anomalies
The results of either of the contouring processes is not perfect as this picture shows:
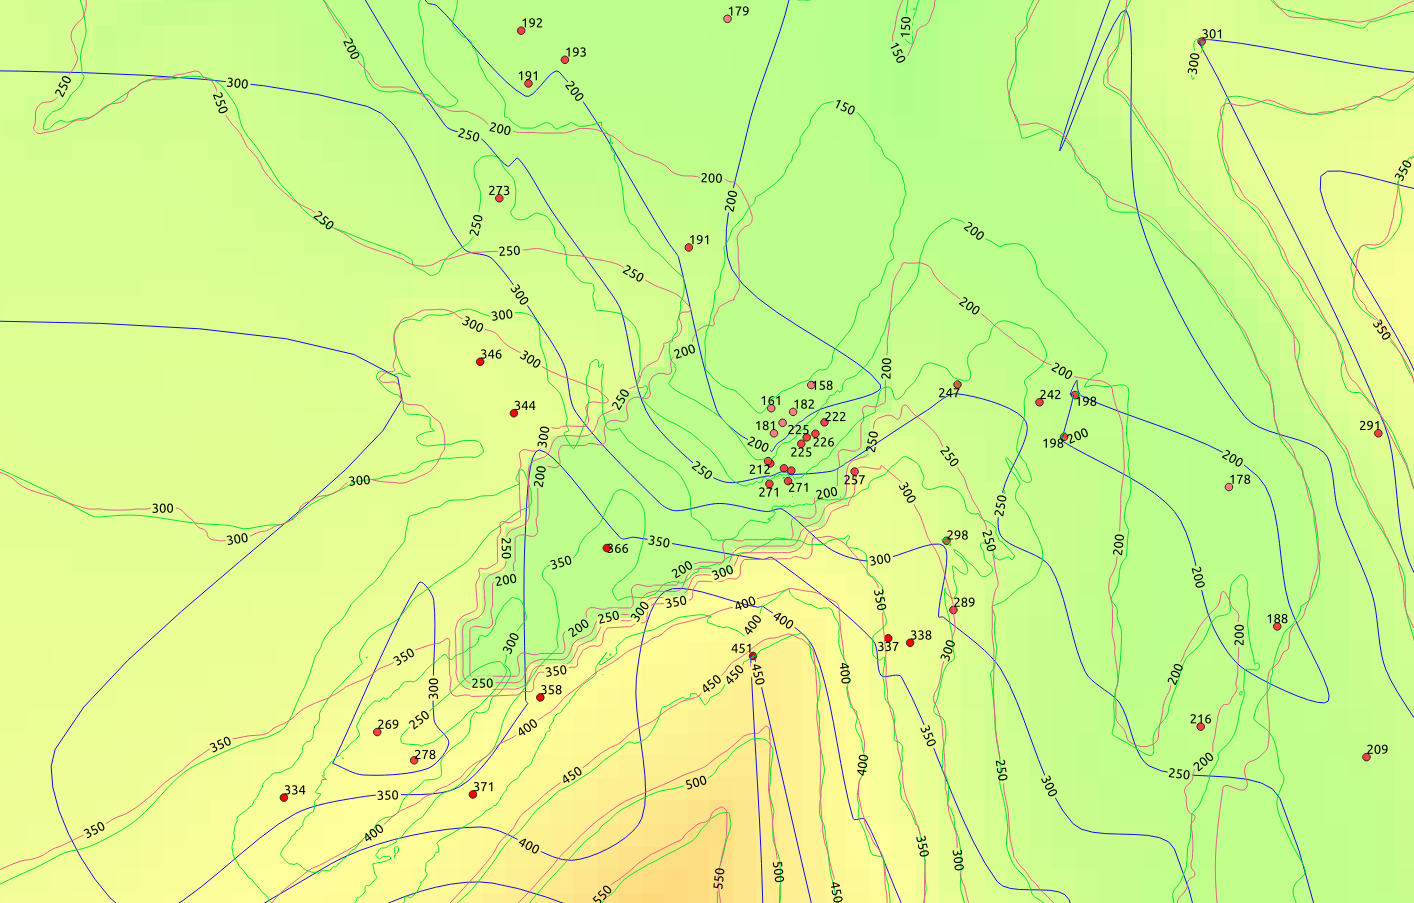
The green lines are Ordnance Survey’s contours (which are probably as close to ground truth as I’m going to get), the blue ones are the vector process from the spot heights, while the red ones are the raster process on the underlying raster. You can see how the red lines follow the pixel edges leading to an interesting stepped effect, while the vector lines (blue) are at 90 degrees to the feature (as all the points to drive it are in the NE corner). Which is better is hard to call, in the valley the vector process is closer to the Ordnance Survey contours, while in other parts of the map where spot heights are rarer the raster process is closer to the truth.
Future Work
I may experiment with adding some sort of spike removal routine to the output contours to try and cut down on some of the more extreme swoops that are seen. I’m also not sure if there are any further steps to allowing the SLD renderer make use of this process, if there are I’ll look at implementing them in the new year.
Conclusions
This seems like it is a quicker (and easier) approach to contouring irregular point data. But you need to be aware of the possible problems that can be generated if there are areas where your data is very sparse.